Social connectedness

 SOCIAL CONNECTEDNESS
| |
WORSENING TREND |
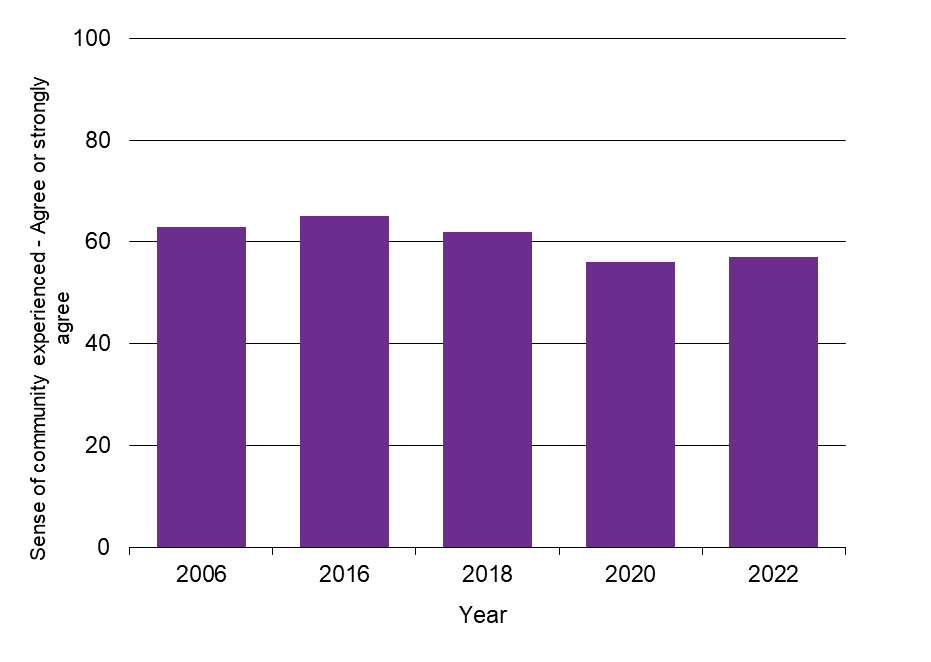
Following a long period of stability in the measure of Waikato people’s sense of community with others in their neighbourhood, the survey results declined in 2020 and slightly recovered in 2022.
This indicator is measured as the percentage of people who agree or strongly agree that they experience a sense of community with others in their neighbourhood. Data are from the Quality of Life Survey.
Why is this indicator important?
People have a basic need to connect with other people for social contact. A lack of social connectedness can impact on people’s overall health. Within communities it can also lead to other problems such as increased crime. Measuring levels of social connectedness can help us to plan for current and future support systems and other resources in our region.
Social connectedness

| Year | Agree or strongly agree |
| 2006 | 63 |
| 2016 | 65 |
| 2018 | 62 |
| 2020 | 56 |
| 2022 | 57 |
What is this indicator telling us?
- Following a long period of stability in this measure, in 2020 there was a statistically significant decline in Waikato people’s reported sense of community followed by a slight recovery in 2022.
- Compared to 2006, a lower percentage of Waikato regional survey respondents in 2022 agree that they experience a sense of community with others in their neighbourhood (57% in 2022 compared to 63% in 2006).
- Across the Waikato region in 2022:
- The percentage of people who agree they experience a sense of community ranged from 47% for Hamilton West and Hamilton East ward respondents up to 73% for respondents in Thames-Coromandel district and the rural part of the Rotorua district that is within the Waikato region.
- Respondents who identified with the Pacific ethnic group were less likely to agree they experience a sense of community with others in their neighbourhood (40%).
- Female respondents were more likely to agree they experience a sense of community (60%).
- Respondents aged 65 and over were more likely to agree that they experience a sense of community with others in their neighbourhood (73%); while respondents aged under 25 years (40%) and 25-49 years (52%) were less likely to agree.
- Based on a question in the 2021 New Zealand General Social Survey, more than half (53%) of respondents from the Waikato region said they felt lonely ‘none of the time’ in the last four weeks, similar to the national average of 57% (sampling error was ±8.7% for Waikato results at 95% confidence level). Over the past decade, there been a decline of more than 10 percentage points in the results for this item at both the regional and national levels.
- In comparison to other developed countries, New Zealand has one of the highest levels of social connectedness. In New Zealand, 95% of people believe that they know someone they could rely on in time of need, more than the OECD average of 91%.
DATA SOURCE AND SUPPORTING INFORMATION
Indicator is the percentage of people who agree or strongly agree that they experience a sense of community with others in their neighbourhood. Data are from the Quality of Life Survey.
The latest NZGSS results for 2021 were released in July 2022. NZGSS time series results for this item are not comparable prior to 2012 due to a change in the question.
Update details: Waikato regional results are available for 2006, 2016, 2018, 2020 and 2022.
Customised data request requirements: Quality of Life data.
DATA AVAILABILITY – OTHER THAN WAIKATO REGION:
Territorial Authority (TA) disaggregation: Yes
Other regions: Yes
New Zealand: No (but 8 cities average is available)
Other countries/ Organisation for Economic Co-operation and Development (OECD): Secondary statistics from the OECD Wellbeing Report: Community – Key findings.


To ask for help or report a problem, contact us
Tell us how we can improve the information on this page. (optional)