Shoreline protection structures
Why we monitor shoreline protection structures
A large portion of the Waikato region’s sandy coastline has become intensively developed, particularly on the Coromandel Peninsula. In many cases, this development has occurred very close to the shoreline, leaving insufficient area between the development and the sea to protect from processes such as natural coastal erosion and future sea level rise. Shoreline protection works are built along the coastal margin when the sea threatens property or infrastructure.
Shoreline protection structures can affect public space and the local environment. In some circumstances, shoreline protection structures can severely degrade the quality of the beach. Waikato Regional Council (WRC) therefore needs to know where shoreline protection structures have been erected and how they affect this region’s beaches and coastline areas. The presence of shoreline protection structures also reflects the degree to which shorelines and coastal developments in the region are under pressure from natural phenomena such as ongoing sea level rise and storms.
WRC has responsibilities for the regulation of shoreline protection structures within its coastal marine area (CMA) under Section 30 of the Resource Management Act (RMA), and the Regional Coastal Plan (RCP).
This indicator will help WRC to monitor pressure on the regions shoreline and whether regional policy and plans are appropriately addressing the issues involved.
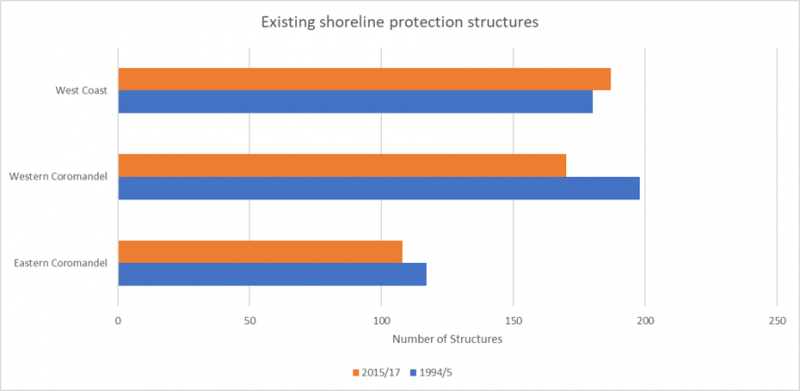
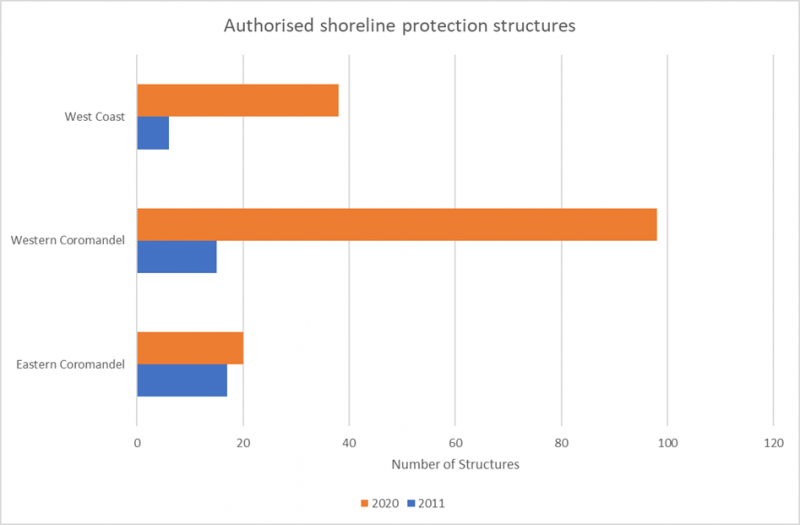
Only a small proportion of the existing coastal protection structures are consented through the RMA, or previous legislation. This indicator reports observations of structures in the field, as well as considering the number of legally established structures.
Shoreline protection structures affect:
- Natural character: The natural qualities of our coastal environment are called natural character. These include natural processes, and the spiritual, cultural, scientific and visual values of our coasts. The natural character of our beaches is important to people in the Waikato region. It is recognised as a matter of national importance in the New Zealand Coastal Policy Statement. Adding foreign material to our coastal areas and preventing altering natural landforms and processes can degrade their natural character.
- Natural processes: People build shoreline protection structures to stop erosion of the land. While groynes can protect dunes by holding sediment in place, they can increase erosion elsewhere if trapped sediment is unable to reach neighbouring beaches. Seawalls can stop dune erosion, but often at the expense of lowering the level of the beach in front of it, so the dry sandy beach is lost at high tide. There can be increased erosion at either end of the seawall where increases in turbulence occur near the ends of the wall (‘end effects’).
- Public values: The effects of structures on natural processes and landforms can make access to the beach and along the beach difficult. Large, poorly designed, or unstable structures can be unsafe (particularly for young children and the elderly). Often alternative public access needs to be created.
It is therefore important that shoreline protection structures are:
- only built where necessary, and
- managed so that their adverse effects can be avoided or reduced.
What's happening?
The Waikato region has about 1,150 km of open coast and estuarine shoreline. There has been considerable urban development in some areas, particularly on the Coromandel Peninsula. Much of this development has occurred close to the shoreline. This means there is not enough space left between the development and the ocean to protect against coastal erosion or the effects of predicted sea level rise.
Shoreline protection structures are more likely to be built in areas where private property is exposed to these coastal hazards. This means our more highly developed beaches tend to have a greater number of protection structures. These structures can affect our coastline’s natural character and make access to our beaches difficult.
Methods - how we monitor
Results - data and trends
Download the data file
This Excel spreadsheet contains the source data to this indicator's graph and any additional data.
When this indicator is updated
The next survey is planned for 2030 and will be repeated every 10 years.


To ask for help or report a problem, contact us
Tell us how we can improve the information on this page. (optional)