Why we monitor rural subdivision
Waikato Regional Council has an important role in managing resources of regional significance, including our productive land and soils. The public expects Waikato Regional Council to take action to maintain the health and productive capacity of the land.
Monitoring rural subdivision provides information to territorial authorities (district councils), land developers and the community on increasing land use pressures in the region. This information indicates:
- the area and productive capability of land removed from large-scale agricultural enterprises
- increased pressure on the environment from subdivision, for example potential water requirements, soil erosion and loss of soil structure, fertiliser leaching and pesticide use
- where traffic volumes may increase, with corresponding increases in pollution, energy use and greenhouse gas generation
- any increase in impervious surfaces leading to increased pressure on stormwater and flood management
- areas where an increased demand for infrastructure and services is expected.
The rural subdivision indicator monitors the amount and type of low-density rural land that has been subdivided into smaller blocks, possibly for intensive agricultural and horticultural enterprises or urban uses. Low-density rural land is described as land with less than one house per four hectares.
The indicator also shows whether land being subdivided has a capability for high or low agricultural production levels.
What's happening?
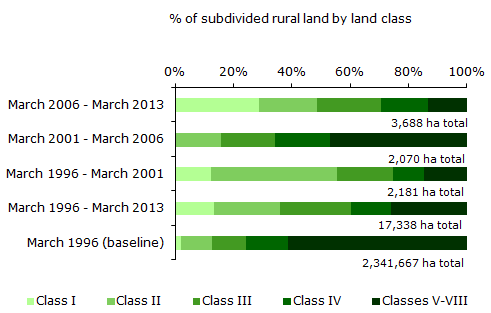
- Between 1991 and 1996, 1,864 hectares of land changed from a low-density rural land use to a more intensive use. Between 1996 and 2001, this figure rose to 2,181 hectares before dropping slightly to 2,070 hectares between 2001 and 2006. Over the most recent 2006 to 2013 census period, this figure has again risen to 3,688 hectares..
- More than two-thirds of the land affected by subdivision has a ‘high productive capability for pastoral use’ (LUC classes I-IV)1 - 67% between 1991-1996, 85% between 1996-2001, 53% between 2001-2006 and 87% between 2006 and 2013.
- The greatest amount of subdivision is occurring on the land with the higher productive capabilities (LUC classes II, III and IV).
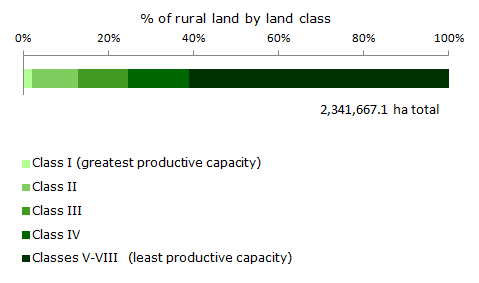
- Within the Waikato region, class I productive land makes up only 1.9% of the total land area. Between 1996 and 2013, 1,334 hectares of class I land was subdivided (0.02% of the total class I land). Over the same period, a total of 1,778 hectares of lower productivity land (classes V-VIII) were subdivided (0.01% of the total class V-VIII land). These classes make up over 61% of the region's land area.
- The greatest amount of subdivision over the 2006-2013 census period has taken place in Waikato District (76% of the total subdivision).
- In decreasing order, rural subdivision is occurring most rapidly in Waikato District, Thames-Coromandel District, Taupō District and Matamata-Piako District. Lower rates of rural subdivision are also takin gplace within Hamilton City, South Waikato District and Ōtorohanga District.
- Between the 1996 and 2006 census, rural land has been subject to the following intensification pressures:2
How we monitor
Data and trends
Download the data file
The link below points to an Excel spreadsheet that contains the source data to this indicator's graph and any additional data.
When this indicator is updated
The rural subdivision indicator will be updated every five years coinciding with each release of the New Zealand Census of Population and Dwellings. The 2013 update has been delayed by two years following the Christchurch earthquakes.
Footnotes
- The productive capability of land in the Waikato region is assessed from the Land Use Capability (LUC) classification in the New Zealand Land Resource Inventory (NZLRI) (NWASCO, 1979). Classes I-IV are reported because they represent land with a high productive capability that is well suited to agricultural or horticultural use but also land that would appeal for urban and lifestyle block development.
- The rural subdivision indicator has been developed from data in the 1991, 1996 and 2001, 2006 and 2013 New Zealand Census of Population and Dwellings. Copyright: Information obtained from Statistics New Zealand may be freely used, reproduced, or quoted unless otherwise specified. In all cases Statistics New Zealand must be acknowledged as the source.


To ask for help or report a problem, contact us
Tell us how we can improve the information on this page. (optional)