Groundwater well construction
Why we monitor groundwater well construction
 This indicator monitors the number of resource consents issued to drill and construct wells below the groundwater table, and the location of those wells. This helps us understand the pressures from development on lcoal and regional groundwater resources.
The region’s groundwater wells supply drinking water for people and animals, irrigation water for agriculture and horticulture activities and water for industrial use. Groundwater wells and piezometers (narrow wells) are also constructed for monitoring and investigating purposes.
Resource consents (permits) are required from Waikato Regional Council for drilling and constructing wells. The consents have conditions attached to them, to help avoid or lessen impacts of the drilling and construction on the water.
Managing groundwater well construction is important as poorly constructed wells can result in badly affect water supplies. Poor well construction can result in uncontrolled groundwater leakage. Inadequate sealing at the well-head can lead to direct contamination of the groundwater, and mixing of isolated aquifers due to the well construction can also affect water quality.
Contractors are required to keep drill-logs as part of their resource consent. These logs provide an important source of information on groundwater resource investigation and management. Waikato Regional Council also checks consented wells to ensure that they are properly constructed, completed and compliant.
Drilling activities above the water table, and temporary drilling (for example, site investigation), are excluded from this indicator as no resource consent is required.
What's happening?
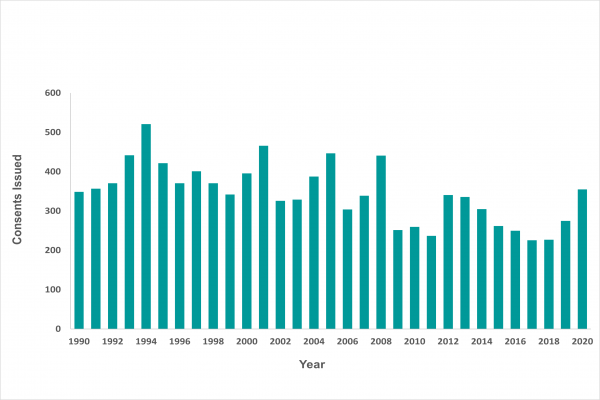
The Waikato region’s groundwater makes up about 90 per cent of our fresh water resource. On average, 345 applications for well construction per year have been issued between 1990 and 2020. A total of 355 applications were received in 2018, slightly above from the previous year. Most well sites are in the Hamilton Basin, southern Hauraki Plains and Pukekohe areas.
Methods - How we monitor
Results - data and trends
The Excel spreadsheet below contains the source data for this indicator's graph and information.

More information
When this indicator is updated
This indicator is updated annually.


To ask for help or report a problem, contact us
Tell us how we can improve the information on this page. (optional)