Income

INCOME
| IMPROVING TREND |
(Note: trend indicator above is relative to 2007 WPI baseline year)
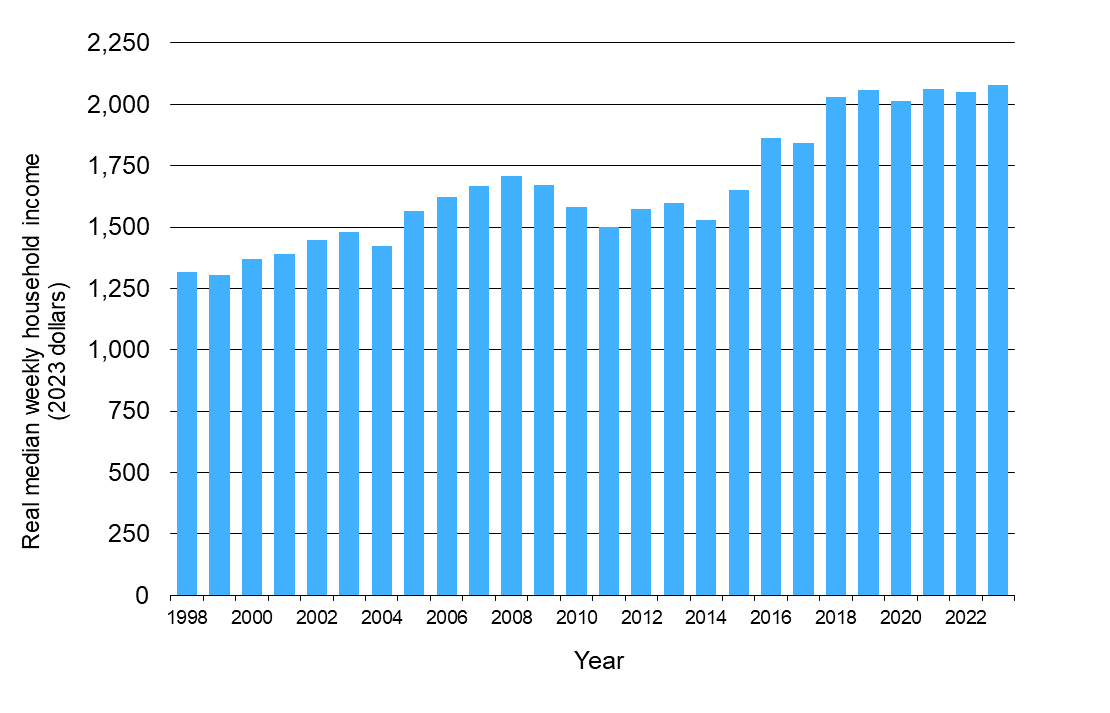
Real median household income in the Waikato region has been relatively unchanged since 2018, and fell slightly during the COVID-19 pandemic, but remains well above levels in past decades.
This indicator is real median household income in the Waikato region. It is calculated from median weekly household income from the New Zealand Income Survey, adjusted by the Consumer Price Index (CPI) (a measure of the average price of consumer goods and services purchased by households).
Why is this indicator important?
How much households earn determines their purchasing power and material standard of living, which has a direct link with the health of our regional and national economy. This measure identifies the midpoint of the range of weekly household income reportedly received during that year.
Income
| Year | Real median weekly household income (2023 dollars) |
| 1998 | 1,318 |
| 1999 | 1,306 |
| 2000 | 1,369 |
| 2001 | 1,389 |
| 2002 | 1,449 |
| 2003 | 1,480 |
| 2004 | 1,423 |
| 2005 | 1,565 |
| 2006 | 1,621 |
| 2007 | 1,669 |
| 2008 | 1,707 |
| 2009 | 1,671 |
| 2010 | 1,581 |
| 2011 | 1,500 |
| 2012 | 1,575 |
| 2013 | 1,596 |
| 2014 | 1,529 |
| 2015 | 1,653 |
| 2016 | 1,861 |
| 2017 | 1,844 |
| 2018 | 2,031 |
| 2019 | 2,059 |
| 2020 | 2,013 |
| 2021 | 2,062 |
| 2022 | 2,052 |
| 2023 | 2,080 |
What is this indicator telling us?
- Median weekly household income in the Waikato region in 2023 was around $130 below the national average in June 2023 (i.e. $2,080 compared to $2,210 for New Zealand overall).
- Real median weekly household income in the Waikato region in 2023 was slightly above the 2022 level (i.e. $2,080 compared to inflation-adjusted $2,052 in 2022).
- In New Zealand, the average household net adjusted disposable income per capita is US$39,024 a year, higher than the OECD average of US$30,490.
DATA SOURCE AND SUPPORTING INFORMATION
Data are found online using Statistics New Zealand's (SNZ) NZ Stat Table Builder for median weekly household income by region.
These SNZ data have been inflation adjusted to June 2023 dollars using quarter 2 Consumer Price Index (CPI) values.
Update details: Annual series with June quarter survey results available in the first week of October.
Customised data request requirements: Nil
DATA AVAILABILITY – OTHER THAN WAIKATO REGION:
Territorial Authority (TA) disaggregation: No
Other regions: Yes
New Zealand: Yes
Other countries/ Organisation for Economic Co-operation and Development (OECD): Comparative data between New Zealand and other countries/OECD are available on the Better Life Index website and on OECD.Stats for various other measures of income per capita.

To ask for help or report a problem, contact us
Tell us how we can improve the information on this page. (optional)